
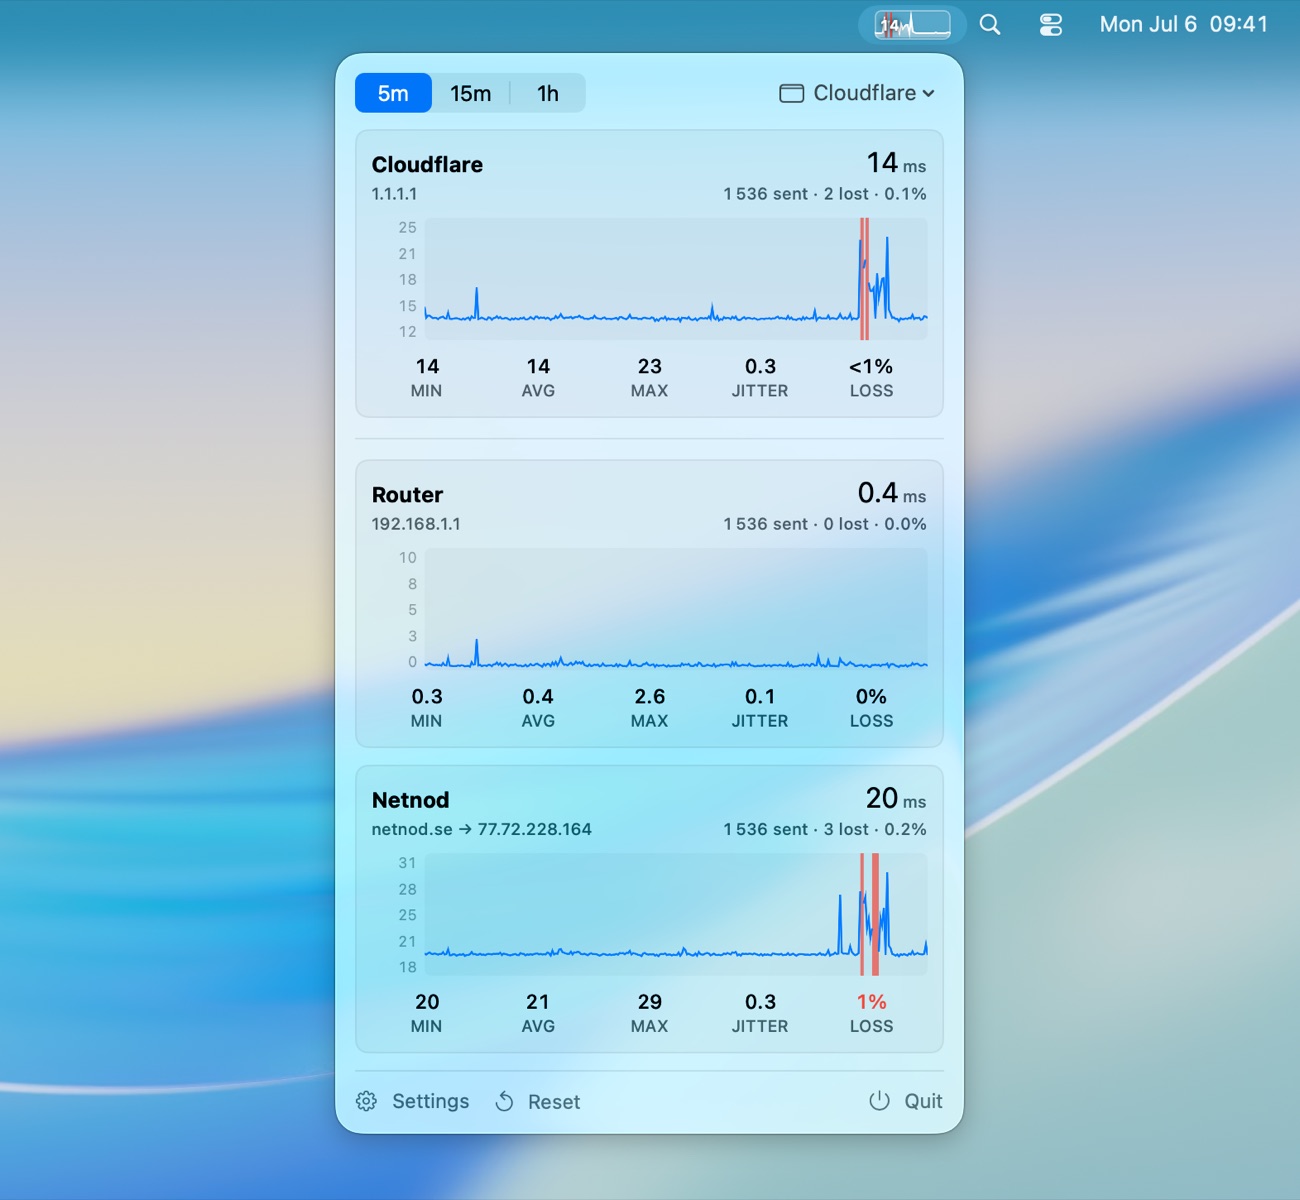
See problems as they happen
Latency spikes and packet loss show up live. Lost packets are drawn as red bars on the graph, and the loss figure turns red when it matters, so problems are easy to spot.
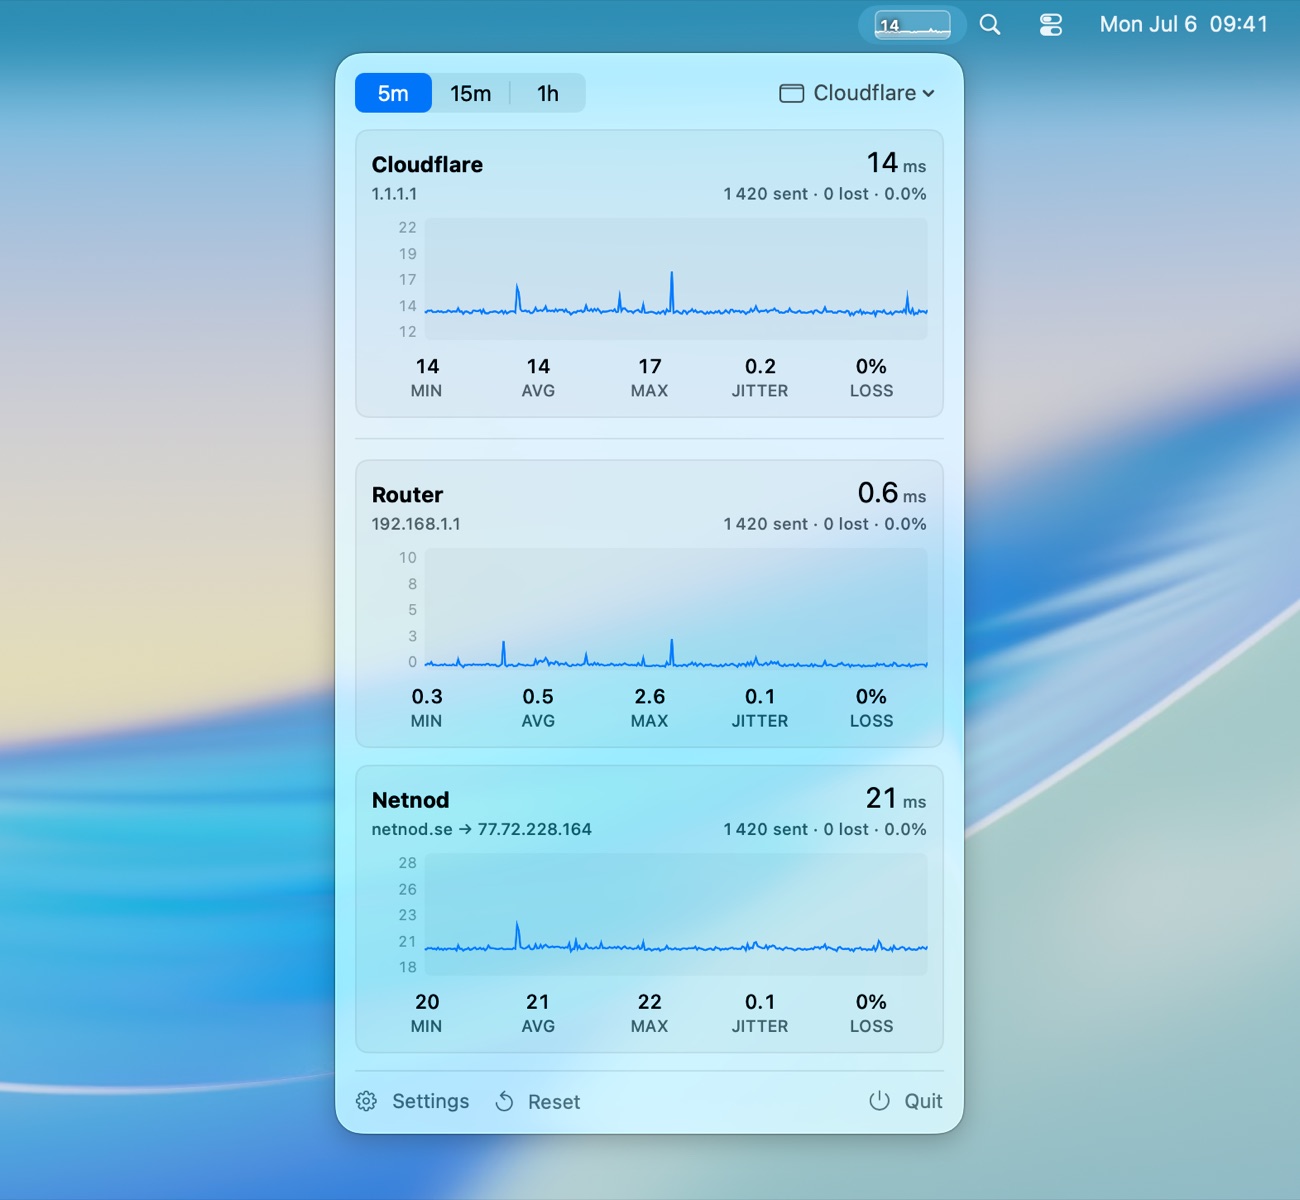
Everything at a glance
- Live in your menu bar. A small latency graph you can read at a glance. Click it for the full panel.
- Several hosts at once. Your router, your DNS, a game or work server, each with its own graph.
- Full stats. Min, average, max, jitter, and packet loss, over 5, 15, or 60 minute windows.
- Native and private. A sandboxed Mac app with no account and no tracking. It only pings the hosts you add.
